
Heat pumps generate rich time-series data, yet anomalies are rare, diverse and often ambiguous — in some ways an ideal problem for machine learning, but it comes with its challenges. In the past, we’ve been able to show that self-supervised neural networks are able to successfully detect when heat pump sensor readings drift outside the distribution of normal operations. This would allow the detection of failure modes that simply aren’t detectable by traditional alarms and provide a benefit to all THMI users. The real challenge, however, has been scaling these models reliably.
Without a structured way to label anomalies, track models and compare their performance, moving beyond MVPs for individual heat pumps into a reliable, universally applicable system has been exceedingly difficult.
Over the past few months I’ve built a small ML training stack that attempts to close that loop.
The problem
In early prototypes, it was easy to get something that looked promising on a subset of units. The harder question was whether a given change to a model actually improved performance consistently across different heat pumps, seasons and operating regimes. Answering that required a scalable data pipeline, a structured workflow for experiment tracking, and not least metrics by which we measure model performance. Without these components, improvements beyond simple proof of concepts mostly came down to gut feeling and guesswork — not an ideal place to be when you want to start deploying alerts to live systems.
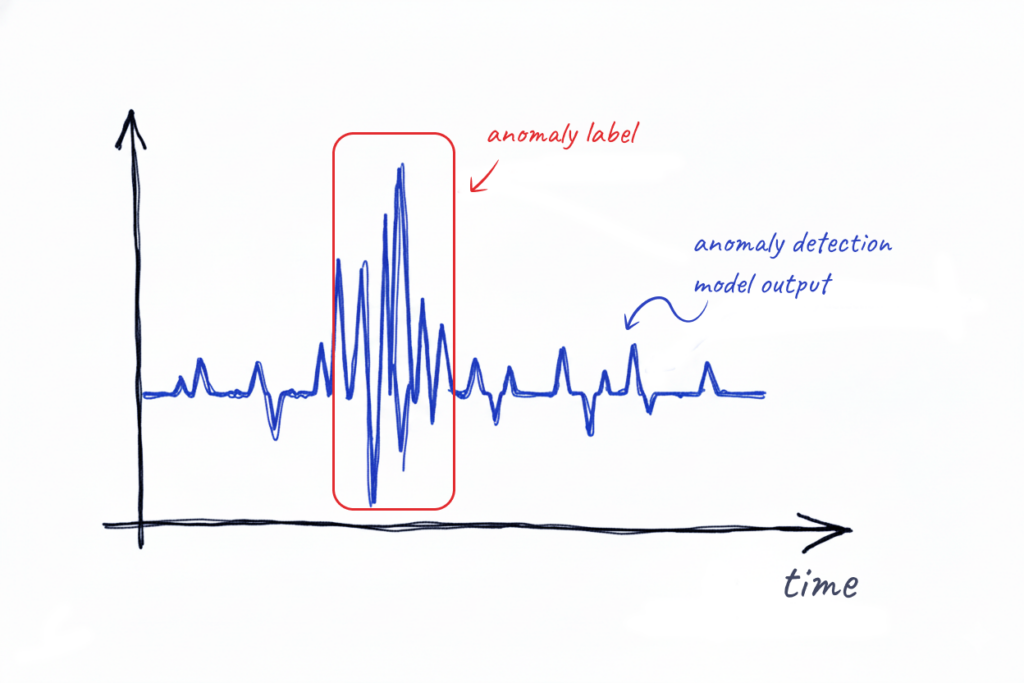
The last component — metrics that measure model performance — is especially tricky as it requires information on when anomalies actually occurred in the dataset. When working with real world heat pump data, obtaining such ground truth labels is not entirely straightforward. For one, we need to make an informed decision about what we count as an anomaly (compressor breakdown? refrigerant leakage? faulty sensor readings?). This requires communication with stakeholders who know what types of events are desirable to detect. Furthermore, we need the input of domain experts and field technicians who can confirm or reject the occurrence of a given anomaly. All of this across a dataset of about a hundred heat pump units.
The vision
The first key insight was that iterating on model structure needed to be easy. The whole loop from prototyping a new model, to training it, to evaluating its performance and seeing if it improved should only be bottlenecked by the rate at which one is able to come up with, implement and train new architectures.
The goal wasn’t to pick the best model, but rather to make model improvements measurable, reproducible and cheap to iterate.
The second key was to stop regarding labels as a static document out of our control. When working on our initial prototypes we had, in dialogue with stakeholders and service technicians, accumulated a decent number of confirmed anomalies. However, these labels were inconsistent in their quality and far from covered the entire dataset. By taking ownership of the labels and storing them in a centralized repository, we could treat them as something to be iterated on, much like the models themselves. The process would look something like this: take the output of the best available anomaly detection model. If it detects anomalies that are not in the current labels, or if the output disagrees with the labels in some other way, talk to domain experts and stakeholders, and make an informed decision about in which cases the model is correct or not.
By repeating these two feedback loops, we not only get better anomaly detection models, but also gradually improve the labels used to evaluate these models, in turn allowing the models to become even more reliable.
The implementation
The attempt to implement this vision consisted of a four main components:
- A centralized store for anomaly labels, to function as a source of truth for evaluating models and to be continuously updated as knowledge increases.
- A small web app in which to create, review and edit these labels, to be used by ML engineers and stakeholders alike and ensure that the labels stay a living document.
- An ML model tracking platform in which to log model info, artifacts and metrics.
- A Python package to provide a programmatic interface to the other components and a unified evaluation process.
Taking ownership of labels
For storing the labels, a small database was the obvious solution. For each anomaly, we needed to store a few given fields; things like start and end datetime, confidence, reviewer, notes and which unit it is associated with. MongoDB was chosen due to its flexibility, relative ease of use and wide support.
Making anomaly labeling user friendly
To support the continuous review and improvement of anomaly labels, a small web app was built where the anomalies from the database can be reviewed and edited, overlaid on the raw data from THMI. This was done using Dash, a Python framework for building data-centric web apps.
Tracking experiments
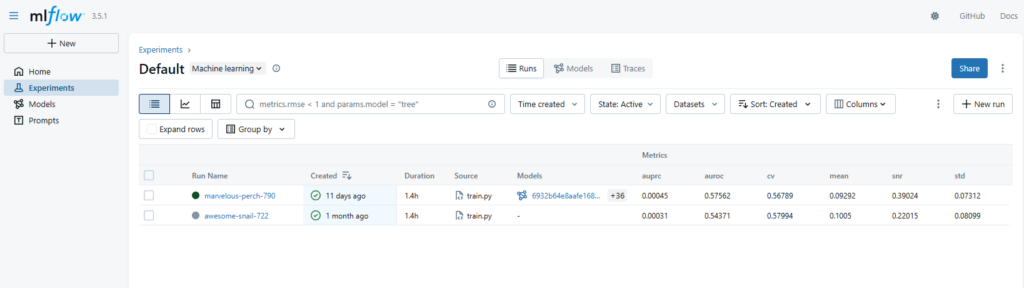
From previous experience we knew that developing machine learning models without a structured workflow can get messy fast, especially when working with large and varied datasets. Luckily there are tools to help mitigate this problem, such as MLflow, a platform for tracking ML models. The MLflow server, which you can self-host, has two main interfaces. The first is a Python API using which you can log models, including their weights, code dependencies and info about the dataset used to train them. This takes significant burden off the ML engineer as they don’t have to worry about keeping track of which weights belong to which version of the code — just log everything to MLflow. More importantly, however, you can also log model metrics, and then use the second interface, which is a web UI, to view and compare model performance.
Building a Python package
Finally, a small Python package was built to handle the scaffolding necessary to make all the other parts work together. This includes things such as providing unified functions for model training and evaluation, computing metrics, ingesting the heat pump sensor data from THMI and preprocessing it in the ways necessary to do machine learning. The package also provides an API for the web app and other scripts to interact with the label database in a consistent manner.
The benefit
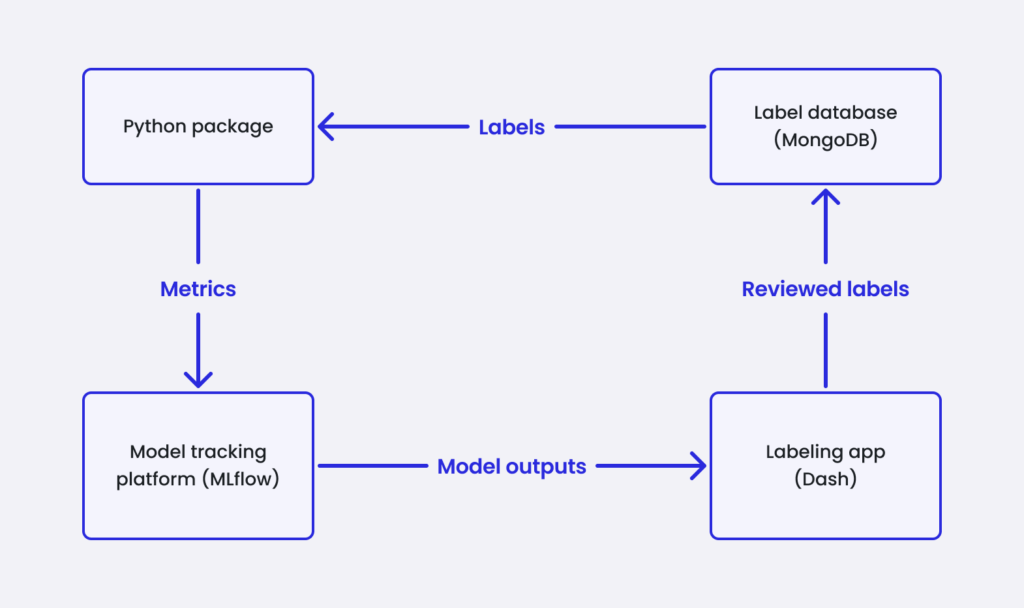
On their own, these components each offer some improvement to the workflow of developing anomaly detection models. But the real benefit comes when they are combined. It is when labels from the database are automatically used for computing model metrics, the models are logged to MLflow, and their outputs are displayed in the web app to allow further refining the labels, that the loop is closed and the vision of continuous improvement of both models and labels can be achieved. This allows a quantifiable iteration of models that not only makes development of anomaly detection easier, but is a necessary prerequisite for growing it into a reliable and scalable product. With this, anomaly detection has gone from a promising prototype to the early stages of a product that can actually bring value to heat pump owners and beyond